|
The spectral power distribution of the mercury discharge depends to a very great extent on the pressure at which it is operating. At low pressures the output is predominantly in the ultra-violet, but as pressure increases self-absorption here results in the visible green, yellow and violet lines becoming relatively stronger.
Above about one atmosphere pressure, a very small amount of continuum radiation begins to enter the spectrum and this progressively increases in strength as pressure continues to rise. It is only just visible in the 10 atmosphere graph below as a continuous spectrum of very low intensity. The addition of wavelengths other than the principal mercury lines by this method can significantly improve the colour rendering properties of the mercury discharge.
At still higher pressures in the tens of atmospheres, line broadening occurs which further enhances colour rendering quality, but the strong peaks still give an overall greenish-blue cast to the mercury spectrum. Continuum radiation can be seen to have significantly increased by this stage. However once pressure enters the region of several hundred atmospheres, the peaks begin to decrease in intensity and the light output gradually attains a more useful colour closer to white.
The spectral power distribution charts in Figure 6 illustrate the changes occurring in the visible part of the mercury spectrum at various pressures. To put the significance of the ultra-violet radiation at low pressures into perspective though, the first chart is on a different scale to include the shorter wavelengths.
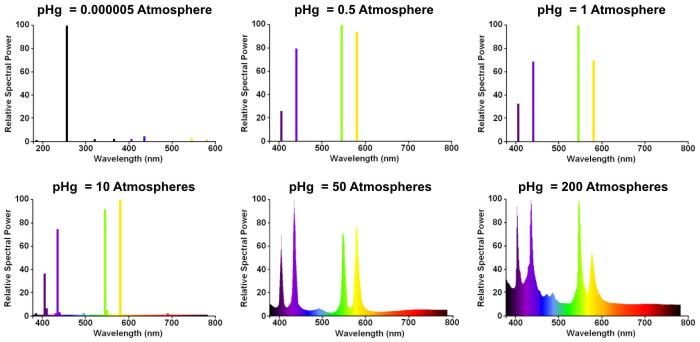
Figure 6 - Effects of Mercury Vapour Pressure on the Spectral Power Distribution
|